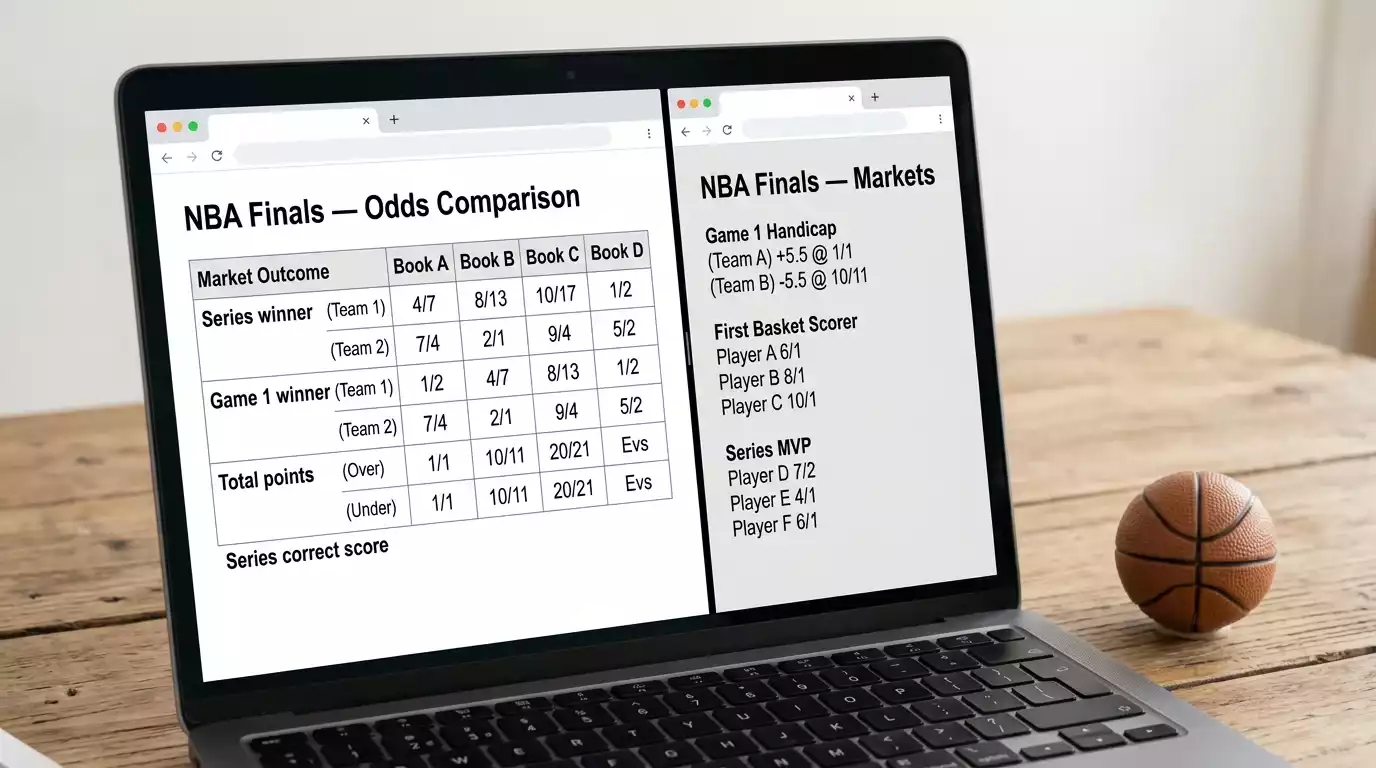
NBA Finals Over/Under Totals UK: Point Scoring Markets
 Available in US

Analyzing NBA Finals Total Points Pricing
I was sitting with a friend during Game 2 of a recent Finals when the total dropped from 218.5 to 213.5 in the space of about ten minutes pre-tip. He asked if there was breaking injury news. There was not. What there was, was a sharp money signal from the bettors who had spent the regular season tracking how Finals officiating crews call games – and the Finals total quietly correcting toward the historical average. That is the market in three sentences, and it is why this is a different game than the regular-season over/under.
The headline pricing context this season is straightforward. With Oklahoma City at -175 to -180 across UK books for the 2026 title and San Antonio at +300 to +320, a hypothetical OKC-SAS Finals series would price game totals somewhere in the 215 to 219 range based on regular-season inputs. The actual numbers UK books will post when the matchup is set will likely sit 4 to 6 points below those projections, and there is a structural reason that gap exists every year.
How a UK book actually builds a Finals total
The total points line on any NBA game is built from two team inputs and an adjustment. The team inputs are offensive rating and defensive rating, both calculated on a per-100-possessions basis to normalise for pace. The adjustment is a pace estimate – possessions per 48 minutes – which the model applies to project total possessions across the game. Multiply expected points per possession by expected possessions and you get a baseline total. UK books then add a small variance correction and a slight juice premium and post the line.
That much is standard. What changes in the Finals is every input. Pace drops because halfcourt defence becomes more disciplined and rotations tighten – teams use fewer transition opportunities, set more half-court possessions, and shooting variance compresses. Offensive rating drops because the best defences play the best defence of the year. Defensive rating, by symmetry, also drops, but not by as much because the offences are still elite. The net result is a total that is 5 to 8 points lower than the same matchup would price in a regular-season game.
UK books that price Finals totals from regular-season averages without adjustment will be wrong. The ones that do the adjustment well will land within a point or two of consensus, which is why mid-stakes shopping across UK apps rarely yields more than a half-point of edge on the line itself. The edge, when it exists, is in the alt-total products and the in-play markets.
The Finals pace history that drives the model
Pace in the NBA Finals has been measurably lower than pace in the corresponding regular season for at least fifteen consecutive years. The exact gap varies – some series run two possessions per game slower, some run five – but the direction is consistent. The 2019 Toronto-Golden State Finals ran around 96 possessions per 48 minutes, when the regular season league average that year was over 100. The 2023 Denver-Miami Finals ran roughly 94 possessions, when the regular season was running closer to 99. The pattern is structural, not coincidental.
The reason is rotation length. NBA Finals teams play seven- or eight-man rotations rather than the ten- or eleven-man rotations of the regular season. Tighter rotations mean better defenders on the court for more minutes, which means halfcourt possessions take longer, which means fewer possessions per 48 minutes. Coaches in the Finals also stretch out timeout usage and run more situational pacing – slowing late-clock possessions to break opponent rhythm – which further compresses total possessions.
The parity backdrop matters here too. Every Finals since 2019 has featured a different champion, which is the longest unique-champion streak in league history. That parity means recent Finals have featured rosters with less playoff continuity than dynasty-era matchups, and inexperienced playoff rotations tend to run more conservatively in the highest-stakes games of the year. UK trading desks have updated their Finals pace priors downward across the past seven years specifically because the parity sample keeps reinforcing the same low-pace pattern.
Referee crews shift the total more than UK bettors think
This is the input that separates casual UK bettors from sharp ones. NBA referee crews have measurable individual tendencies – some call more fouls per game, some call fewer; some are tighter on the perimeter, some tighter in the paint. Those tendencies translate directly into total points: more fouls means more free throws, which means more points; tighter perimeter calls mean more dribble-drive penetration, which means higher-percentage shots. A high-foul crew can lift a game total by 4 to 8 points relative to a low-foul crew on the same matchup.
NBA referee assignments for the Finals are released about 90 minutes before tip-off, which is a tight window for UK bettors but a usable one. The published assignments name the three on-court officials plus the alternate. A bettor who has tracked referee tendencies across the playoffs can adjust their model for the specific crew and identify games where the posted line over- or under-weighted the referee effect.
The referee effect is also where UK bookmakers themselves move the line. Sharp money in the 60 minutes before tip-off frequently reflects referee assignments, and UK books that see consistent money on one side of the total can shift the line by half a point or a point in that window. A bettor who places a Finals total bet without checking the referee assignment is leaving the most reliable single piece of in-game information on the table.
Alt-totals and the dispersion premium
Most UK apps offer alternate total points lines beyond the standard over/under – typically in 5-point increments above and below the headline number, sometimes in 10-point increments for higher-variance games. A standard Finals game might post 217.5 as the central line and alt-totals from 207.5 up to 227.5. The juice on alt-totals widens as you move away from the central number, because the bookmaker is charging a dispersion premium for the lower-probability outcomes.
The dispersion premium is where UK bettors with a strong directional thesis can find better value than the central line. If you believe a specific Finals game will go significantly under because of a slow-pace officiating crew, betting the under at the central total locks in roughly even-money returns. Betting the alt-under at 5 or 10 points below the central total gives you a higher payout on the same directional thesis, and if your read on pace is correct the variance compensates for the longer odds. The reverse works for overs – though overs in the Finals are historically the harder side to win, given the structural pace compression.
One UK-specific note: alt-totals settle in tenths of a point, but some bookmakers price them as whole numbers with push protection. Read the rules on whichever app you use before stake-sizing on alt-totals, because a push handling difference of half a point can flip the expected value of a thin-edge bet.
In-play total points: where the line actually moves
The pre-game total is the version of the market most UK bettors interact with. The in-play total is the one where the real action lives. UK books recalculate the total points line continuously during the game, using a model that ingests current score, time remaining, possession count, and team-specific pace adjustments. The result is a moving target that updates every dead-ball and frequently mid-possession.
The strategic opportunity for UK bettors is the predictability of certain in-play moves. A high-scoring first quarter typically pushes the live total upward – but historical data shows that high first-quarter games regress to mean over the course of a full Finals game more often than they sustain. A UK bettor who tracks first-quarter pace against historical priors can identify spots where the in-play total has overcorrected upward and the under is offering value.
The same logic works in reverse. A low-scoring first half in a Finals game can push the live total down meaningfully, but the second half of Finals games – particularly in series that have produced extended fourth quarters – has been historically slightly higher-scoring than the first half. The live under that looks attractive at half time may be the wrong side of a structural pattern.
The in-play work is the kind of thing that compounds across a Finals series. The bettor who watches every game with the total open on their second screen builds an intuition for when the live model is overreacting, and that intuition is genuinely valuable. If you want a structured walk through the broader in-play playbook, the deeper tactical work sits in our in-play nba finals uk tactics piece.
Why are NBA Finals totals lower than regular season averages?
Finals teams run seven- or eight-man rotations rather than the ten- or eleven-man rotations of the regular season, which means better defenders are on the court for more minutes and halfcourt possessions take longer. The result is fewer possessions per 48 minutes and lower total points – typically 5 to 8 points below the same matchup’s regular-season projection.
How do referee crews affect the line?
NBA referee crews have measurable individual tendencies. Crews that call more fouls produce more free throws and higher total points; crews that call fewer perimeter fouls produce more dribble-drive penetration. A high-foul crew can lift a Finals game total by 4 to 8 points relative to a low-foul crew on the same matchup. Crew assignments are released around 90 minutes before tip-off.
Published by the nba Final Bets team.