NBA Futures Closing Line Value UK: Measuring True Betting ROI
 Available in US
Table of Contents
- Applying CLV Mechanics to NBA Futures
- Why CLV matters more on futures than on any other market
- How to measure CLV when the market thinks in fractional
- Steam moves on the NBA board and how to spot them in real time
- Soft versus sharp UK books: who moves first, who follows
- The sample size trap that ruins CLV analysis
- Transferring CLV analysis to Conference Finals pricing
- What an integrity event does to your CLV baseline
- Tooling, tracking and the spreadsheet that does the maths for you
- The CLV questions that come up most often in client calls

Applying CLV Mechanics to NBA Futures
If you ask me what the single most useful number in my entire professional setup is, the answer is not my model output, not my probability estimate, not even my win-loss record. It is the average closing line value across my last 200 NBA bets. That one number, kept in cell B2 of a sheet I review every Sunday, is the only metric that has reliably told me, across a decade of betting, whether what I am doing is producing genuine edge or just running hot. Win rate alone cannot do that. Profit alone cannot do that. CLV can.
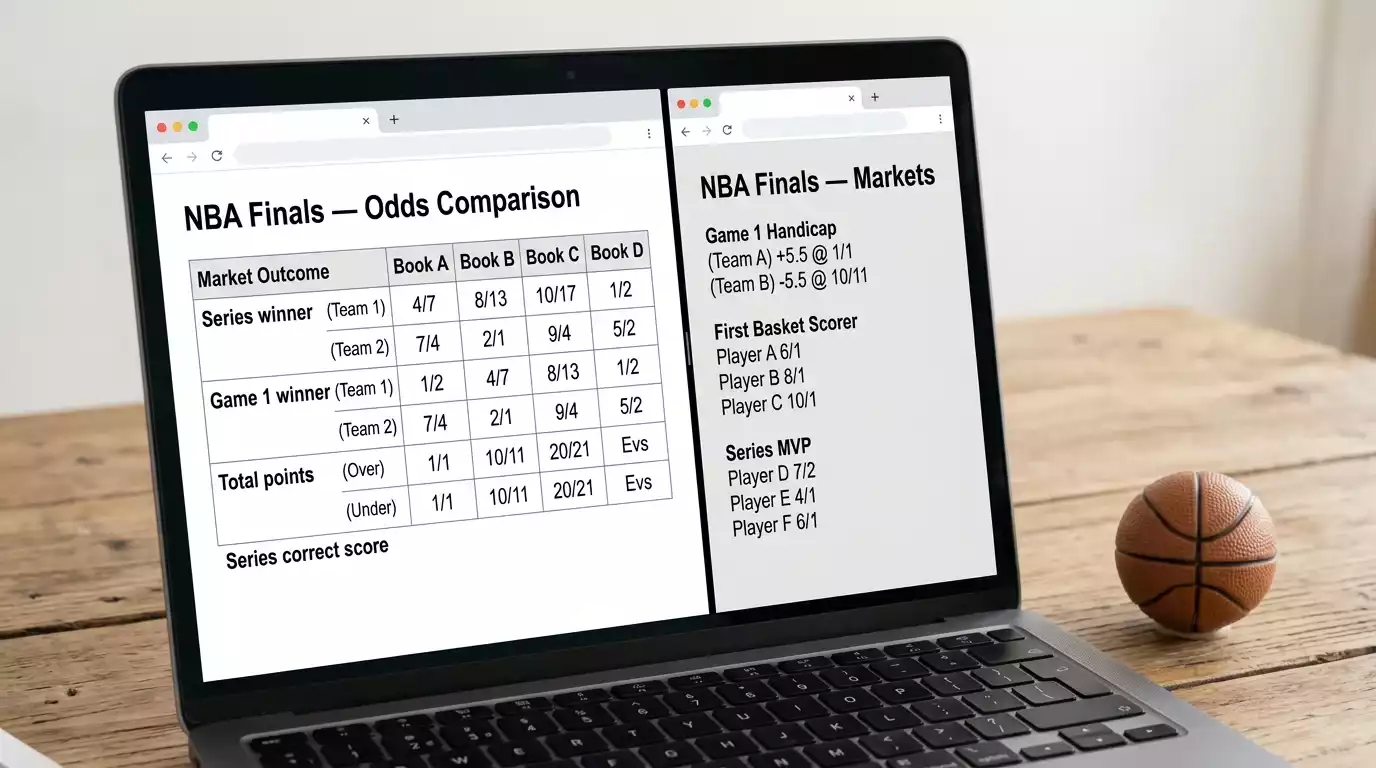
Closing line value is the difference between the price you took on a bet and the closing price at the moment the market settled — for a single-game NBA bet, that is the price at tip-off. For an NBA Finals outright, the closing price is the price at the start of Game 1 of the series. If you took OKC at 4/7 in October and the market closed at 1/2 by the start of the 2026 Finals, you beat the close, and you beat it by a meaningful margin. The mechanics of converting fractional to implied probability give you the precise gap — 4/7 implies 63.6%, 1/2 implies 66.7%, so you took a price 3.1 percentage points worse than the close. Wait — that is the wrong direction. You took 63.6% and the close was 66.7%, so the market moved towards your bet by 3.1 points. You beat the close.
That mechanical reading is the foundation of every claim about edge in professional betting. Win rate is noisy. Profit is noisy. CLV is the signal that survives noise because it measures whether you systematically take prices that the market eventually agrees were too generous. For UK bettors working in fractional, the only adjustment is the arithmetic — but the principle is identical to the way US sharps talk about beating -110 closers. Across a long enough sample, positive CLV is the only honest evidence that you have edge.
Why CLV matters more on futures than on any other market
The longest CLV gap I have ever logged on a single bet was eleven months. I took a price on a Western Conference team in early August at 25/1. The market closed at 8/1 by the start of the Finals. Across that eleven-month window the implied probability had moved from 4% to 11%, a swing of seven points on a single ticket. Whether or not the bet eventually won is almost beside the point — the price had been mispriced by the market for nearly a year, and the spreadsheet captured the entire walk.
Single-game NBA bets give you about 90 minutes of CLV runway. The opening line gets posted the morning of the game, the closing line is set at tip-off, and the entire price-discovery process happens in that window. By comparison, an NBA Finals outright gives you eight to ten months of CLV runway. The Larry O’Brien Trophy market opens in July, and the relevant closing line is the price at the start of Game 1 of the Finals the following June. That long hold time creates a long path of price movement, and a long path of price movement is what makes futures the cleanest market in which to measure CLV.
The mechanical reason long-horizon CLV is more reliable than short-horizon CLV is that the eventual closing price aggregates more information. The closing price on a Game 3 spread reflects the market’s best read on a single basketball game with one or two days of news. The closing price on a Finals outright reflects the market’s best read on eight months of news — trades, injuries, coaching changes, win-loss records, integrity events. The signal is stronger because the sample of information that feeds into it is larger.
For UK bettors specifically, futures CLV is also where the structural difference between books shows up most clearly. The single-game market is efficient across all UK operators because the volume is enormous. The futures market is less efficient because the volume is thinner and the prices update less frequently. That inefficiency creates persistent gaps between books on the same outright, and exploiting those gaps is exactly what CLV measurement is designed to identify.
The other thing to know about CLV on futures is that it survives a losing bet better than win rate does. You can take 25/1 on a team that finishes the season at 8/1 implied probability — meaning you genuinely beat the closing market — and the bet can still lose because the team finishes fourth in the East rather than winning the title. Your CLV on that bet is positive. Your P/L on that bet is negative. Across a hundred similar entries, the positive-CLV strategy wins. Across a single entry it can look like a loss. That decoupling is the entire reason CLV is the better long-run metric for futures.
The implication for the UK Finals bettor is that you should measure CLV every time you place a futures bet, even if you do not yet have a long enough sample to draw conclusions. The discipline of recording the opening price and the closing price builds the dataset that, two seasons in, lets you finally see whether your edge is real.
How to measure CLV when the market thinks in fractional
The single most useful spreadsheet column I have ever added to my CLV tracker is the implied probability column. Not the fractional. Not the decimal. The implied probability. That is the unit in which CLV actually lives, and the only reason most UK bettors fail to track CLV properly is that they try to compare fractional to fractional directly, which is mathematically misleading.
Take the headline example. I took OKC at 4/7 in late October. The Thunder are currently sitting at roughly the same fractional, with the implied probability at 63.6%. If the market continues to firm up and the price shortens to 4/9 by the start of the Finals, the closing implied probability would be 9 ÷ (4 + 9) = 69.2%. The CLV on the bet, measured in implied-probability terms, is 69.2% minus 63.6%, or 5.6 percentage points. That number is comparable to the CLV on any other bet I have placed in any market, in any format. The fractional movement from 4/7 to 4/9 is not directly comparable across bets. The implied-probability movement is.
The formula for converting fractional to implied probability is the one piece of arithmetic every serious UK bettor should be able to do in their head. For a fractional price written as a/b, the implied probability is b ÷ (a + b). For 4/7, that is 7 ÷ 11 = 63.6%. For 7/2, that is 2 ÷ 9 = 22.2%. For 10/1, that is 1 ÷ 11 = 9.1%. For 50/1, that is 1 ÷ 51 = 2.0%. The conversion is one calculator press away, but doing it in your head builds the intuition that lets you read a board fluently rather than mechanically.
The CLV calculation itself is then trivial. Implied probability of the closing price minus implied probability of the opening price you took, expressed in percentage points. A positive number means you beat the close. A negative number means the close moved against you. The magnitude of the number is what tells you how much you beat the close by.
Here is a worked example I run with clients. You took the Knicks at 6/1 in early November — implied 14.3%. By March the price has firmed to 9/2 — implied 18.2%. By the start of the Finals it has firmed further to 11/4 — implied 26.7%. Your CLV in implied-probability terms is 26.7% minus 14.3% = 12.4 percentage points. That is an enormous beat. In a long-run sense, taking prices that consistently produce CLV in the 5- to 15-point range on futures is the cleanest evidence of professional-level edge that exists.
One important refinement. When the market closes in a different format than the one you opened in, the conversion happens at the implied-probability level. If you took 4/7 in fractional at a UK book and the most reliable closing price reference is from Pinnacle in decimal at 1.50 — implied 66.7% — the comparison still works because both prices have been converted to a common unit. The format of the bookmaker’s display is cosmetic. The implied probability is the substance.
The mistake I see most often in UK CLV tracking is that bettors record the opening price and forget to record the closing price, or they record the closing price from a different book than the opening price. Both errors corrupt the dataset. The discipline is to fix the closing reference in advance — I use Pinnacle when available, the best available UK price when not — and to record both prices in implied-probability terms in the same row of the same spreadsheet.
Steam moves on the NBA board and how to spot them in real time
Three winters ago I watched the price on a Conference Finals favourite move from 11/8 to 5/4 to 11/10 to even money in the space of 27 minutes. Four prices, four book updates, ascending order across every UK operator I had open at the time. That is a steam move. It was triggered by an injury report that hit the wire at 11:43pm UK time, and the books that updated fastest were trading on -EV against the books that updated slower. I caught the 11/8. The casual UK bettor who looked at the line at 11:55pm saw even money and probably assumed it had always been priced there.
A steam move, in the language of the trade, is a sudden coordinated price movement across multiple books triggered by sharp money or a piece of public information the market is collectively reassessing. The defining feature is speed — steam happens in minutes, not hours. The secondary feature is direction — every book moves the same way, because they are responding to the same underlying signal. The casual bettor watching one book sees a single price change. The professional watching six books sees the wave.
For UK bettors the practical way to spot steam is to keep a dashboard of three to five UK books open during high-traffic windows — the morning after games, the hours following injury reports, and after major roster news during the regular season. If you see a fractional price firm at one book and then watch the same price firm at three others within five minutes, you are watching steam.
The window of opportunity is small. Sharp money moves first. Books that pay attention to sharp money move within minutes. Books that pay attention slowly — and there are several of those in the UK market — move within an hour. The opportunity is to take a price at a slow-moving book that has not yet caught up.
The risk of misreading steam is real. A single book moving is not steam — it might be a re-balancing trade specific to that book’s exposure. Three books moving the same direction in five minutes is steam. The discipline of waiting for the second and third confirmation is what separates careful CLV-building from impulsive line-following.
The deeper mechanics of how UK books communicate price information through aggregators and back-office systems — and which books in the UK market consistently move first versus which lag — sit in my piece on how steam moves through UK NBA books.
Soft versus sharp UK books: who moves first, who follows
The categorisation that matters most in the UK market is not who has the best welcome offer. It is who moves their prices first when news breaks, and who waits an hour to follow the consensus. The sharp books, by definition, are the ones that move first. The soft books are the ones that follow. Knowing which is which on your slip is the difference between systematically positive CLV and systematically negative CLV across a season.
The sharp end of the UK market is small. The books that consistently lead the line on NBA futures are a handful of operators with deep trading desks and direct exposure to professional money. Their prices move within minutes of major news. They tolerate sharp action because they have the infrastructure to manage their exposure dynamically. They also tend to offer slightly worse headline prices on the favourites because they have already priced in the sharp money that the soft books have not yet seen.
The soft end of the UK market is wider and includes most of the operators a casual UK bettor would name first. These books move slower because their customer base is largely recreational. The headline prices at soft books are often slightly more generous than at sharp books at any given moment, but the prices lag the true market, which means CLV on bets taken at soft books is structurally lower over a long sample.
The professional move is counterintuitive. You watch the sharp books to read where the price is going, and you place the bet at the soft book that has not yet moved. The CLV builds because you took the soft-book price before the soft book caught up. The window is small — minutes to a couple of hours — and it requires accounts at multiple books watched in parallel. That setup is more work than most UK bettors are willing to do, which is exactly why the opportunity persists.
The pattern is most visible on Sunday mornings during the regular season. The sharp books update overnight. The soft books update by mid-morning. There is a four-hour window when the same outright price exists at meaningfully different fractional values across the UK market. Building positive CLV during those windows, week after week, is what compounds into genuine edge.
The flip side is that taking prices at sharp books on the favourite is a losing proposition unless your read is genuinely better than the sharps’. A casual UK bettor who consistently bets at the sharpest book is paying a small implicit premium for betting into a price that already reflects the smart money. Most CLV losses I see in client portfolios come from this exact pattern.
The sample size trap that ruins CLV analysis
The conversation I have most often with newer bettors goes like this. They tell me they have been tracking CLV for two months, they have placed thirty bets, the average CLV is plus 4 percentage points, and they want to know whether they have edge. I tell them they have a thirty-bet sample, which is statistically equivalent to throwing a coin in the air a few dozen times and asking whether the coin is biased. They have no idea yet. They might. They probably do not. The honest answer is: place 470 more bets and ask me again.
Fifty bets is not a sample. Fifty bets is an opening anecdote. The variance on a fifty-bet CLV average is so wide that you can post a plus 5 number on pure noise and a minus 5 number on genuine edge, depending entirely on which fifty bets happened to land in that window. The smallest sample I trust to give a meaningful CLV signal is around 500 entries, and even then I treat the read as preliminary. By 1,000 entries the signal is real. Below 500 it is mostly noise dressed as a number.
The mechanical reason is that CLV per bet has its own variance, distinct from the variance of the win-loss outcome. A bet with plus 5 CLV is taken at a price that the market eventually decided was worth, on average, 5 points more implied probability than you paid. But the actual closing price on any individual bet fluctuates around the true fair value with a standard deviation that, for NBA futures, is roughly 3 to 5 percentage points. Over a small sample that noise dominates the signal. Over a large sample the noise averages out.
The practical implication for a UK bettor is patience. If you are tracking CLV, you are running a multi-season project, not a single-Finals project. The bets you place across an entire NBA regular season plus the playoffs will get you somewhere between 200 and 600 entries. That is the start of a real sample. The honest conclusion you can draw from a single Finals run is essentially zero.
The other version of the trap is selective recording. If you record CLV on the bets that beat the close and forget the ones that did not, you are not measuring CLV — you are measuring your memory of CLV. Logging every bet, including the ones that closed against you, is what protects the dataset from selection bias.
Transferring CLV analysis to Conference Finals pricing
The cleanest CLV runway during a single NBA post-season actually sits in the Conference Finals window, not the Finals proper. The reason is that Conference Finals series last roughly two weeks each, the prices move daily, and the closing line on a Conference Finals winner is set at the end of that series — which is exactly when the Finals outright closes for the team that advances. There is a natural double-CLV measurement window that does not exist in any other part of the playoffs.
Take a concrete example from the current board. OKC Thunder are pinned at roughly 4/7 on the Larry O’Brien Trophy, with Spurs at 3/1 and Knicks at 11/2. If the Western Conference Finals shape up as Thunder versus Spurs, the series price on the Thunder might come in at around 4/9 to win the series, which converts to roughly 69% implied probability that they advance to the Finals. The Spurs price to advance might be 13/8, or 38% implied. The implied probabilities sum to 107%, with the seven points being the book’s overround on the series market.
The CLV analysis you can run inside that window is more granular than the outright equivalent because the timescale is shorter. The Thunder open the WCF at 4/9 on a Monday morning. The Spurs win Game 1 on the Tuesday night. The Thunder price drifts to 4/7 by Wednesday morning. You can record that movement, mark your entry at 4/9, and compute CLV against the closing price as the series progresses. If the Thunder eventually advance, your CLV on the series ticket is settled at the end of Game 4 or Game 5 or whenever the series concludes.
The reason this matters for Finals analysis specifically is that the Conference Finals closing prices feed directly into the Finals opening prices. A team that closes the WCF at 4/9 to win that series is implicitly being priced at the same level as the corresponding Finals opening price. Tracking the relationship between WCF closing prices and Finals opening prices, across multiple post-seasons, is one of the cleanest research projects a serious UK bettor can run.
The practical move during the current 2026 cycle is to maintain parallel CLV records for the WCF, the ECF, and the Finals. The three windows are sequential, and the closing price of each becomes a meaningful reference for the next. Bettors who treat the post-season as one continuous arc of CLV measurement rather than three separate events build a denser dataset.
What an integrity event does to your CLV baseline
The morning of 24 October 2025 broke my CLV spreadsheet in a way that has lasted ever since. The US Department of Justice indicted thirty-four people across two cases, six of them in an NBA-specific case that named Miami guard Terry Rozier and Portland head coach Chauncey Billups. By the time UK books opened for normal trading that day, every prop market had been paused, every futures price had widened its spread, and the closing-line references I had been using as a CLV baseline were no longer comparable to the opening prices I had recorded.
Adam Silver said it directly in a halftime interview that evening, telling the audience there was “nothing more important to the league and its fans than the integrity of the competition.” That sentiment translated, mechanically, into market disruption. Books widen their spreads when they cannot trust the underlying integrity signal. Wider spreads mean closing prices become less informative as a CLV baseline.
For a UK bettor running CLV analysis through an integrity disruption, the methodologically clean response is to flag the affected window in the spreadsheet and exclude those bets from the headline CLV calculation. Including them creates noise that does not reflect your bet selection — it reflects an exogenous event that affected every entry placed during the disrupted period. The bets are still real and the P/L is still real, but the CLV signal is contaminated.
The longer-term effect of the integrity disruption is that the baseline closing prices on player-prop markets are now structurally wider than they were before October 2025. That is the market pricing in a permanent risk premium. CLV analysis on player props therefore has to be calibrated against the new baseline, not against the pre-disruption baseline. The change is small in absolute terms — maybe one to two percentage points of overround on a typical prop market — but it compounds across a season and changes the threshold for what counts as a positive-CLV bet.
The cleanest response in my own work has been to keep two CLV columns in the spreadsheet — one for outright and series markets, which were largely unaffected, and one for player-prop markets, which I now treat as a separate dataset with its own baseline. Mixing them produces an average that obscures both. Separating them lets me see which part of my bet portfolio is genuinely generating edge and which part is being eroded by the post-October-2025 widening.
Tooling, tracking and the spreadsheet that does the maths for you
The spreadsheet I use is plain Google Sheets, no add-ons, no fancy automation. It has eleven columns and a single conditional-formatting rule that highlights bets with CLV above plus 5 in green and below minus 5 in red. That is the entire setup. People assume my professional infrastructure must be more elaborate. It is not. The discipline is in the columns and the consistency, not the tooling.
The columns I track are: date placed, market type, team or player, opening fractional, opening decimal equivalent, opening implied probability, closing fractional reference, closing decimal equivalent, closing implied probability, CLV in percentage points, and result coded as win, loss, or void with P/L in pounds. Every column matters. Dropping any of them creates a hole in the dataset that you will regret six months later when you try to slice the data by market type or by source book and find you cannot.
The one calculation that earns its column is the weighted CLV. Not all bets are the same size, and a CLV of plus 8 on a £5 bet does not carry the same weight in your portfolio as a CLV of plus 2 on a £50 bet. The weighted CLV is the stake-weighted average of the per-bet CLV figures, and it tells you the headline number that actually matters to your bankroll. The raw average can mislead. The weighted average tells the truth.
The other tooling decision worth making is where you pull the closing reference price from. I use Pinnacle as the primary closing reference because their no-vig pricing is the closest thing to a fair-value baseline in the market. When Pinnacle does not list the market — which happens on some niche UK-specific markets — I use the best available UK price as a fallback. The consistency of the reference matters more than which specific reference you choose. Switching references mid-season destroys the comparability of the dataset.
The maintenance burden is small. Entering a bet takes about ninety seconds — copy the opening price, compute the implied probability, log the stake. Updating the closing price takes another sixty seconds at the time the bet settles. Across a Finals series of fifteen to twenty bets, the total time spent on the spreadsheet is around an hour. That is the cheapest hour of work in the entire professional setup. It produces the only honest record of whether the rest of the work is paying off.
The CLV questions that come up most often in client calls
How do I calculate CLV when my opening price was in fractional and the closing was in decimal?
Convert both to implied probability first, then subtract. The format of the bookmaker’s display is cosmetic — fractional, decimal and American all express the same underlying number in different notation. For a fractional price written as a over b, the implied probability is b divided by the sum of a and b. For a decimal price, the implied probability is 1 divided by the decimal. Once both prices are in implied-probability terms, the CLV is the difference between them measured in percentage points.
What CLV threshold over fifty NBA bets suggests I have real edge?
Fifty bets is not a large enough sample to draw any reliable conclusion. The variance on a fifty-bet CLV average is wide enough that genuine edge can show as a negative number and pure noise can show as a strong positive. The smallest sample I treat as informative is around 500 entries, and even then I treat the read as preliminary. Across 1,000 entries a sustained CLV above plus 2 percentage points is meaningful. Anything you measure across fifty bets is mostly noise.
Does a single integrity scandal reset the closing line value baseline?
On the affected markets, yes, the baseline shifts. Books widen their spreads in response to perceived integrity risk, which means the closing prices after the disruption are not directly comparable to closing prices before it. The cleanest methodological response is to flag the disrupted window in your spreadsheet and exclude those bets from the headline CLV calculation. Player-prop markets in particular have settled at a structurally wider baseline since October 2025, and CLV analysis on those markets has to be calibrated against the new baseline rather than the historical one.
Published by the nba Final Bets team.